Lab 05: Vibration Testing of Beams
AE 417 · Aerospace Structures and Instrumentation Laboratory · Fall 2025 · ERAU
Experiment Overview
When a structure’s natural frequency matches the frequency of an applied periodic load, resonance occurs — and loads can build catastrophically. This principle destroyed the Tacoma Narrows Bridge in 1940 through aeroelastic flutter and drives flutter clearance testing on every new aircraft. This lab experimentally determined the resonance frequencies and mode shapes of aluminum beams using an electrodynamic shaker, providing direct experience with the vibration testing methods used in structural qualification programs.
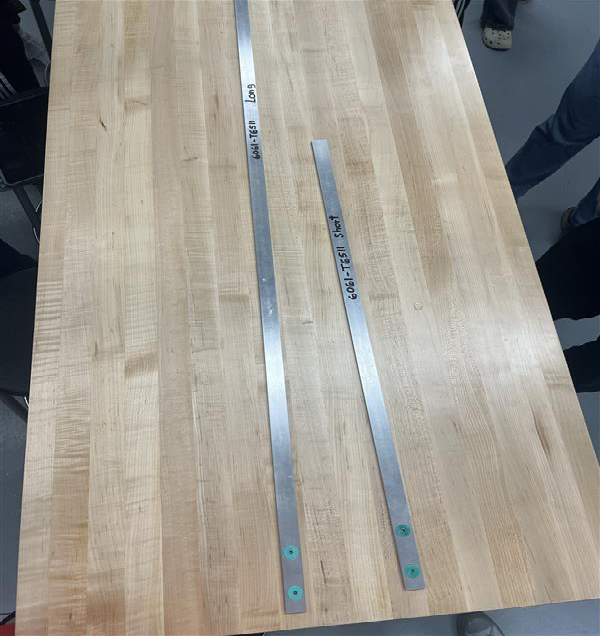
- Measure resonance frequencies for the first 3 modes of a short beam (761 mm) and 4 modes of a long beam (1275 mm) of Al-6061-T651
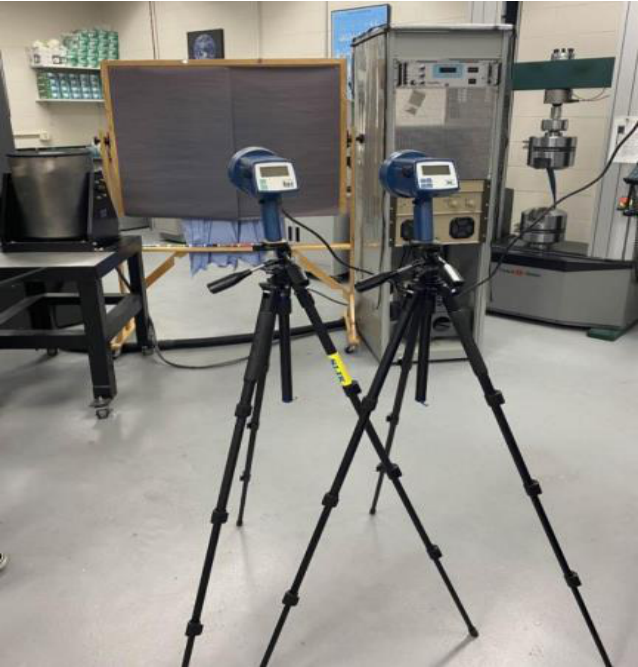
- Use three independent measurement methods simultaneously: sine generator readout, ICP accelerometer/oscilloscope, and digital stroboscope
- Measure nodal positions at each mode using the stroboscope to “freeze” the vibrating beam
- Compare measured frequencies and nodal positions against Euler-Bernoulli beam theory predictions
Equipment & Tools
- Al-6061-T651 beam samples: short (761 mm) and long (1275 mm), similar 25×5 mm cross-section
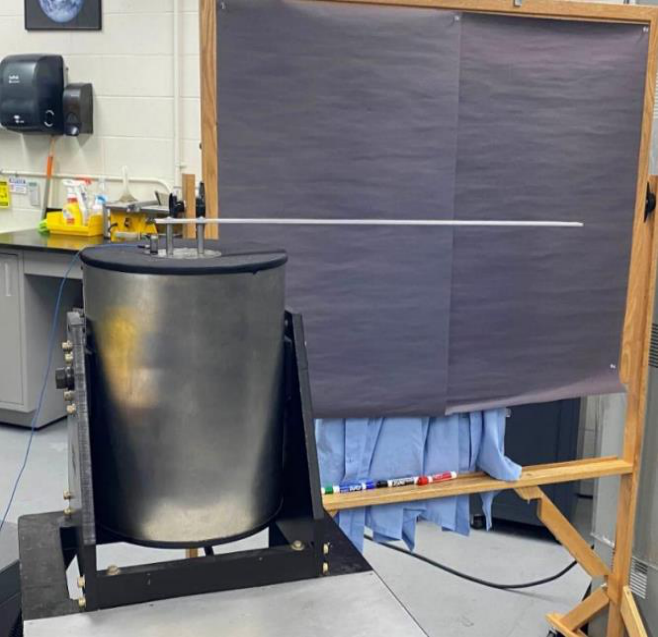
- Electrodynamic shaker with cooling fan and power supply amplifier
- Sweep sine generator (frequency range: DC to 200 Hz)
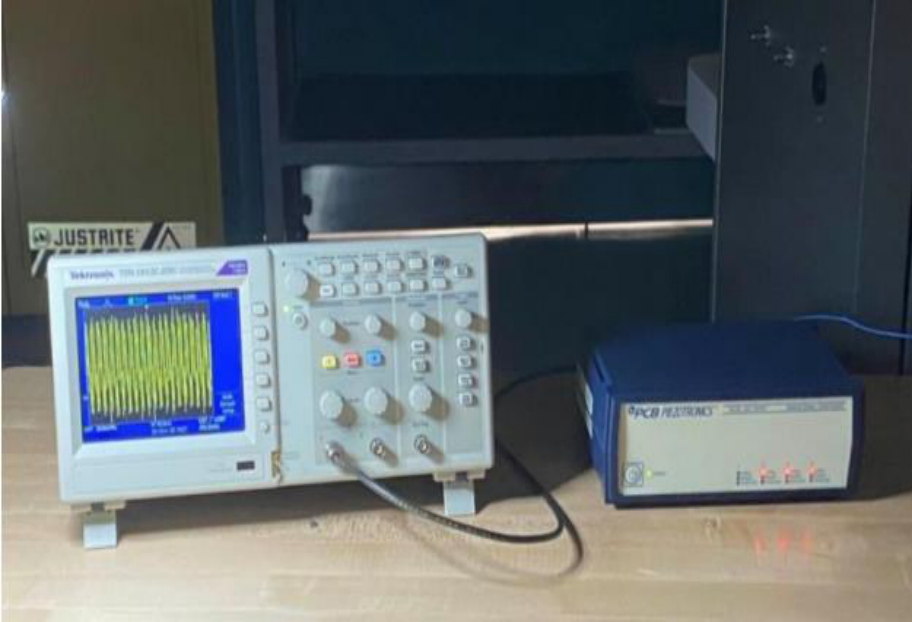
- ICP® integrated-circuit piezoelectric accelerometer and sensor signal conditioner
- Digital oscilloscope (reading period in voltage and seconds)
- Digital stroboscope on adjustable tripod (0–150,000 flash/min)
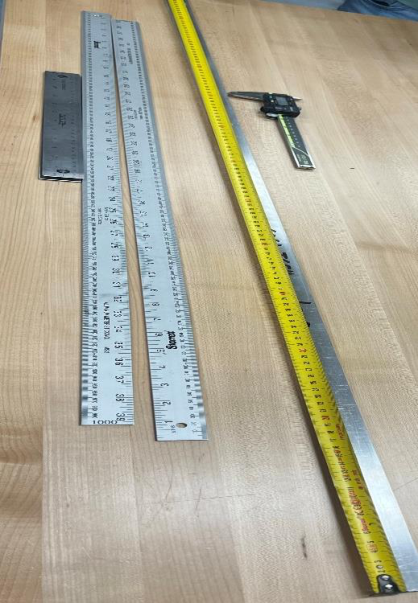
- Hot glue gun (for accelerometer attachment), calipers, ruler, and tape measure
Approach & Theory
Each beam was clamped to the electrodynamic shaker and the sine generator frequency increased from zero until large-amplitude oscillation indicated resonance. Resonance frequency was captured simultaneously from three instruments: the sine generator display (FSSG), the digital oscilloscope period measurement from the ICP accelerometer (Fpiezo), and the stroboscope flash rate that visually froze the beam (Fstrobe). Nodal positions were measured with a ruler while the beam appeared stationary under strobe illumination.
Theoretical resonance frequencies were computed from the Euler-Bernoulli beam equation: ωn = (λnL)² / L² · √(EI/ρA), using eigenvalues λL = 1.88, 4.69, 7.85, and 11.00 for modes 1–4. Theoretical nodal distance ratios x/L for each mode shape were used to compute expected node positions.
Lab Footage
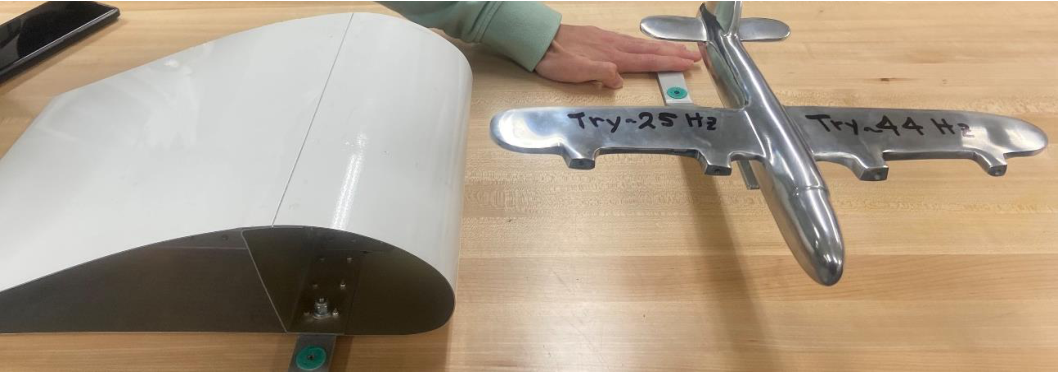
Videos captured during the experiment showing the aluminum beams vibrating at resonance under the electrodynamic shaker. The stroboscope was used to visually “freeze” the beam mid-oscillation and identify nodal positions at each mode.
Key Results
- Short beam frequencies (Hz) — Mode 1: 6.5, Mode 2: 40.1, Mode 3: 111.5. Long beam — Mode 1: 2.4, Mode 2: 14.5, Mode 3: 40.9, Mode 4: 80.1.
- Percent difference from theory: 9.5–11.6% for the short beam and 5.3–8.0% for the long beam — longer beams behave more like ideal Euler-Bernoulli beams, as clamping boundary conditions and root effects are proportionally smaller.
- At Mode 1 for the short beam, FSSG and Fpiezo differed by 13.6% — the piezo oscilloscope struggles at very low frequencies (<10 Hz). All three methods converged to <3% agreement at higher modes.
- Nodal positions matched theoretical predictions within 3.32% for both beams across all modes — demonstrating that visual node identification via stroboscope is a reliable measurement technique even if the frequency measurement itself has some scatter.
Valuable Takeaways
- Resonance frequencies can be identified experimentally with high confidence. The 3.32% nodal position accuracy and sub-8% frequency accuracy relative to theory validate vibration testing as a reliable structural identification method — the principle behind ground vibration tests (GVT) performed on every new aircraft before first flight.
- Measurement instrument selection matters at low frequencies. The piezo oscilloscope’s 13.6% error at Mode 1 of the short beam versus <1% for the stroboscope and generator shows that instrument bandwidth is a practical constraint, not just a specification sheet number.
- Resonance avoidance drives structural design decisions. Knowing a structure’s natural frequencies lets designers ensure no operational forcing frequency — engine RPM, blade passing frequency, or aerodynamic buffet — falls within the resonance bands where catastrophic amplitude build-up can occur.
- Gained hands-on proficiency with electrodynamic shakers, ICP accelerometers, digital stroboscopes, and oscilloscopes — the core instrumentation suite for structural dynamics testing in both academic and industrial programs.